ir spectroscopy
Fourier Transform Infra Red Spectrometers
In contrast to the dispersive IR spectrometers, where the signal from the sample is dispersed and the response at each wavelength (or wave number) is measured individually, the FT instruments collect the response at all the wavelengths simultaneously. In these multiplex instruments the monochromator is replaced by an As these instruments employ dispersion of radiation, these are called dispersive IR spectrometers. Michelson interferometer is employed for the modulation of the signal; the output from the interferometer is an interferogram and the response of the sample to the whole range of IR radiation is suitably modulated and collected in the time domain. These are then decoded using the Fourier transformation. Therefore it is named the Fourier transform infra red spectrometer (FT-IR).
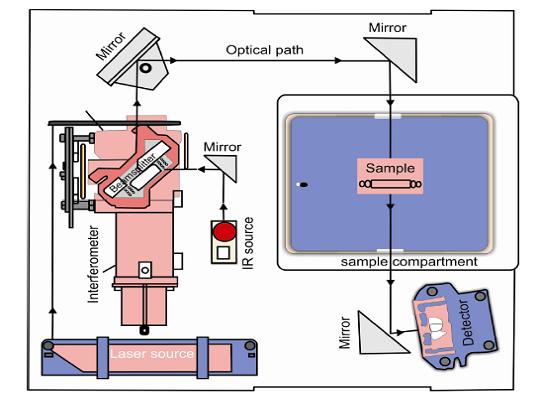
The basic instrument design for an FT-IR instrument is quite simple. A schematic diagram showing different components is given in Fig. . The IR radiation from the source is first directed into an interferometer from where it is passed through the sample compartment and then it reaches to the detector.
In FT-IR spectrometers two types of detectors are commonly used. These are deuterated triglycine sulfate (DTGS) and mercury cadmium telluride (MCT) detectors.While, the DTGS detector is a pyroelectric detector that measures the changes in temperature, MCT detector is a photon detector that depends on the quantum of radiation generating electricity. Both of these detectors deliver rapid responses.Further while the DTGS detectors operate at room temperature, MCT detectors need to be maintained at liquid nitrogen temperature (77° K) to be effective. An important aspect of FT-IR is that most bench top FT-IR spectrometers are singlebeam instruments and do not obtain transmittance or absorbance IR spectra in real time. A typical operating procedure is as follows:
Steps in getting an FT-IR spectrum of the sample with interferometer
1. In the first step, an interferogram is recorded without any sample in the beam and saved in computer memory. This interferogram is characteristic of the experimental set up and consists of the response of the spectrometer in terms of the performance of source, interferometer, and the detector. This so called background spectrum also includes the contribution from any ambient water and carbon dioxide present in the optical bench.
2. The interferogram is recorded again; this time with a sample introduced into the beam and also stored in computer memory. It contains signals from the sample and the background air or solvent.
3. The first interferogram is subtracted from the second with the help of a computer.
4. The resulting difference interferogram is then Fourier transformed to give the spectrum.
In the process of taking the difference between the two interferograms the absorption due to atmospheric gases is also removed.